

Detection Target
Determination of Airborne Free Silica Content
Overview
This solution conforms to the ISO 19087 Workplace air — Analysis of respirable crystalline silica by Fourier-Transform Infrared spectroscopy. This document is a standard for the analysis by Fourier-Transform Infrared (FTIR) of respirable crystalline silica (RCS) in samples of air collected on collection substrates (i.e. filters or foams). Three analytical approaches are described for whom the dust from the sample collection substrate is (1) analysed directly on sampled filter. (2) recovered, treated and deposited onto another filter for analysis, or (3) recovered, treated and pressed into a potassium bromide (KBr) pellet for analysis.
Principle
The airborne free silica primarily consists of α-quartz. A standard curve can be established using certified α-quartz reference material, and the absorbance values obtained from sample measurements can then be interpolated into this curve to determine the free silica content in the samples.
Operating Conditions
Instruments and Accessories
1)HKL-19087 FTIR Spectrometer for Free Silica in air
2)tablet Press Die
3)tablet Press
4)Agate Mortar
5)Infrared Drying Cabinet
Reagents
1)Certified α-quartz Standard (99% purity)
2)Potassium Bromide (KBr, spectroscopic grade)
Sample Collection
Depending on the testing purpose, the sampling location and time may vary, so appropriate sampling methods should be selected. When the amount of dust collected on the filter membrane exceeds 0.1 mg, it can be directly used for the determination of free silica content by this method.
Sample Pretreatment
Precisely weigh the dust mass (G) on the filter membrane.
Fold the dust-laden side inward three times and place it in a porcelain crucible.
Ash in a low-temperature ashing furnace or resistance furnace (<600°C), then cool and store in a desiccator.
Weigh 250 mg of a mixture of KBr and the ashed dust sample, and then grind in an agate mortar until homogeneous.
Place the mixture along with the tablet die in a drying oven (110±5°C) for 10 min.
Press the dried mixture in a tablet die under 15–20 MPa for ~1 min to prepare the sample tablet.
Process a blank filter membrane the same way as a control sample.
Standard Curve Preparation
Precisely weigh 10.0 mg, 20.0 mg, 50.0 mg, 70.0 mg, and 90.0 mg of the master batch (a mixture of standard α-quartz and KBr, with α-quartz content = 10 μg/mg).
Add KBr powder in amounts of 240.0 mg, 230.0 mg, 200.0 mg, 180.0 mg, and 160.0 mg, respectively.
Thoroughly mix each in an agate mortar and transfer to a tablet die for pressing.
Scan the tablets against an air background and record their IR spectra (900–600 cm-1).
| Table 1 | |||
Serial | Sample Weight (g) | α-Quartz Mass (μg) | Absorbance (798 cm-1) |
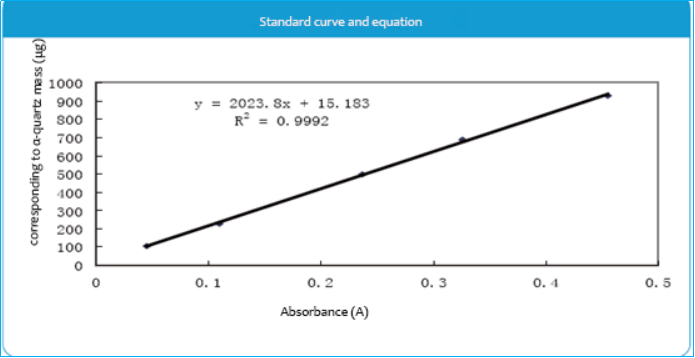
1 | 0.0106 | 106 | 0.0447 |
2 | 0.0228 | 228 | 0.1092 |
3 | 0.0499 | 499 | 0.2367 |
4 | 0.0687 | 687 | 0.3257 |
5 | 0.0927 | 927 | 0.4553 |
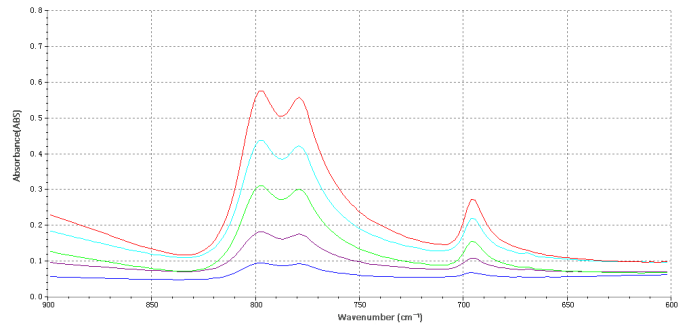
Using the baseline at 827–628 cm-1, measure the absorbance (A) of the standard curve at 800 cm-1. Then, construct the standard curve by plotting the mass of standard α-quartz (μg) on the y-axis against the corresponding absorbance (A) on the x-axis. Determine the curve equation and R2 (see Figure 1).
Validation of the Calibration Curve
Accurately weigh a sample mass (precisely to 0.001 g), mix it with potassium bromide (KBr) powder to a total weight of 250 mg, and then completely transfer the mixture into a tablet die for pressing.
Scan the prepared tablet using air as the background, and record its infrared spectrum in the range of 900–600 cm-1. Substitute the absorbance value near 800 cm-1 into the calibration curve equation to calculate the recovery rate (see Table 2).
| Table2 | |||||
Serial | Weighed Sample Mass (g) | Equivalent α-Quartz Ma ss (μg) | Absorbance at 798 cm-1 | Calculated Mass from Calibration Curve (μg) | Recovery Rate (%) |
1 | 0.0207 | 207 | 0.098 | 0.2135 | 103.1 |
2 | 0.0304 | 304 | 0.1438 | 0.3064 | 100.7 |
3 | 0.0402 | 402 | 0.2036 | 0.4228 | 105.2 |
Conclusion
The calibration curve method demonstrates simplicity in operation and high accuracy for determining free silica content in air. With satisfactory recovery rates in validation tests, this method proves to be an ideal analytical approach for airborne free silica quantification.